I worked with Jim Bell at Cornell for my PhD, focusing on preparing for the Mars Science Laboratory (Curiosity rover) mission. This work included a detailed study of Gale crater as a potential landing site, and developing improved methods estimating chemical compositions using laser induced breakdown spectroscopy (LIBS) spectra. I also investigated the potential for correlating the chemical composition of targets on Mars to their Pancam spectra.
PhD Thesis
R. Anderson, Lasers and landing sites: The geomorphology, stratigraphy, and composition of Mars, Ph.D., Cornell University, 2012. https://ecommons.cornell.edu/handle/1813/29170
Gale Crater
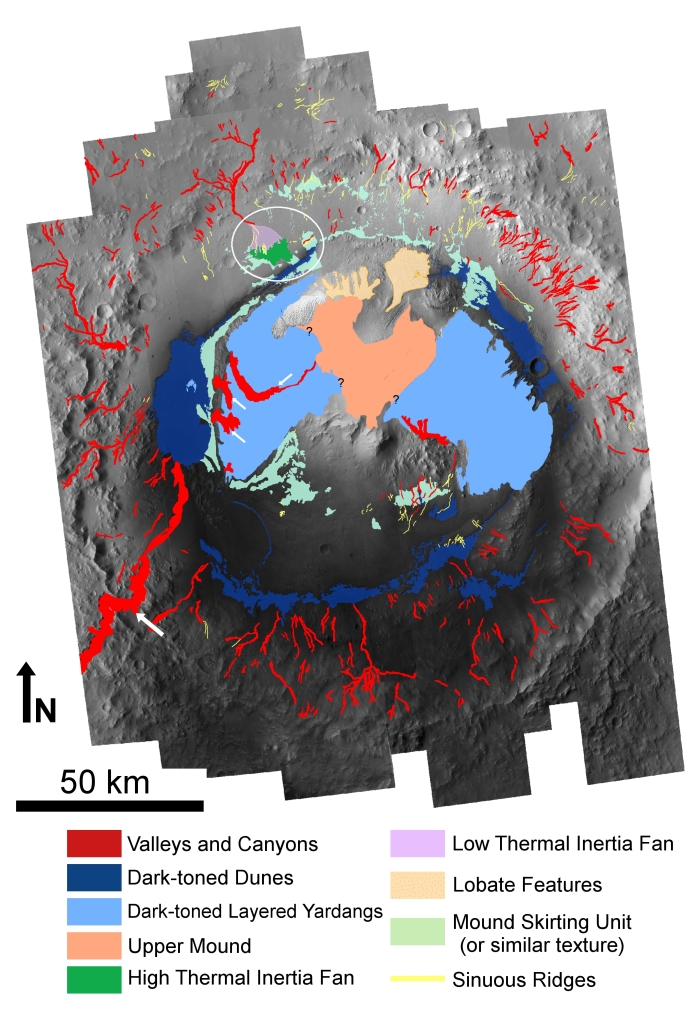
I conducted one of the first detailed studies of the geomorphology of Gale crater, a site that was at the time one of several candidate landing sites for the Curiosity rover mission. I presented my mapping and geomorphology work at several of the landing site selection meetings, and my work played an important role Gale crater’s eventual selection as the landing site for Curiosity.
Here is a post that I wrote on my Martian Chronicles blog about the landing site selection, with many figures from my work on the site: MSL to Land at Gale Crater
It has been a unique privilege to study a site in such detail from orbit and then be part of a mission that landed there and traversed across the area I mapped (following a path not far off what I initially proposed!). I never get tired of seeing a part of Gale crater from the ground that I first saw from space.

Publications and Presentations
R.B. Anderson, J.F. Bell III, Geologic mapping and characterization of Gale Crater and implications for its potential as a Mars Science Laboratory landing site, The Mars Journal. 5 (2010) 76–128. https://doi.org/10.1555/mars.2010.0004. (Open Access)
Landing Site Workshop Presentations:
- The Geomorphology of the Proposed MSL Field Site in Gale Crater, 4th Landing Site Workshop, 2010
- Science Targets Along a Proposed Gale Crater Traverse, 5th Landing Site Workshop, 2011
Laser-Induced Breakdown Spectroscopy (LIBS)

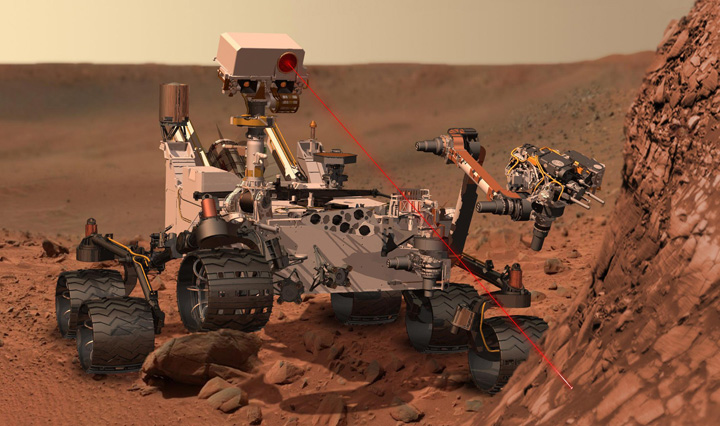
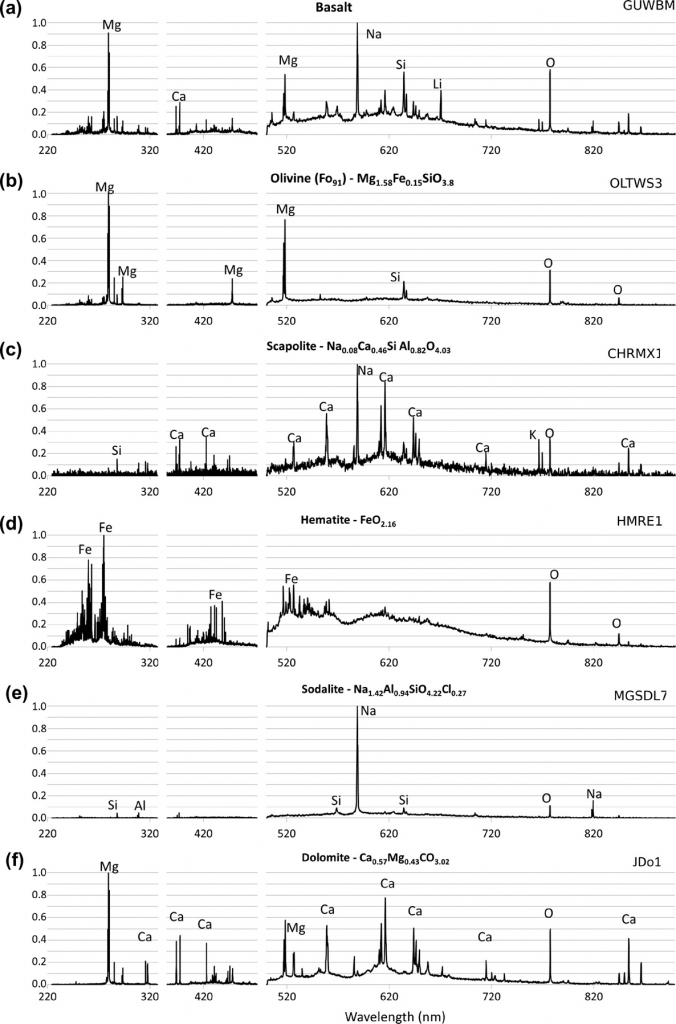
I was a NASA Graduate Student Research Program (GSRP) fellow from 2008 to 2011. This fellowship allowed me to collaborate with Dick Morris at NASA’s Johnson Space Center Astromaterials Research and Exploration Science (ARES) division and Sam Clegg at Los Alamos National Laboratory (LANL). Dick’s lab at JSC has a large suite of well-characterized rock slabs used for calibrating planetary instruments. Together we designed a large vacuum chamber in which to conduct laser-induced breakdown spectroscopy (LIBS) analyses of his samples. LIBS works by firing short but extremely intense laser pulses at a target, turning a tiny amount of material into a spark of plasma. Light from the plasma is collected and separated out into its constituent colors to form a spectrum. Every element on the periodic table gives off light at characteristic wavelengths, so by carefully studying LIBS spectra, we can tell how much of each element is in the target.
The LIBS instrument for JSC was not ready yet when I was starting my work, so we brought the rock samples to LANL and shot them with a laboratory instrument similar to ChemCam, which was being developed to fly on the Curiosity rover.

Using the large suite of spectra collected using the LANL instrument and the JSC samples, I investigated data analysis techniques to improve the accuracy of the chemistry estimates that we get from LIBS. Estimating the chemistry is not as simple as measuring the strength of an emission line from the element you want to quantify. The abundance of other elements in the plasma, the properties of the target and how it absorbs the laser light, the distance, focus, target geometry, and many other factors can complicate the strength of the emission lines. It is complicated enough that we have to turn to advanced multivariate regression methods (a.k.a. “machine learning”) to partially correct for these effects and accurately go from spectrum to composition.
My first LIBS paper compared neural networks and partial least squares (PLS) for quantitative measurements of the composition of rock slabs and found that for our data, neural networks did not really do better than PLS. That paper also discussed the effects of target grain size on the accuracy of the derived composition (unsurprisingly, more analysis points give a better estimate of bulk composition in coarse-grained targets). My second LIBS paper examined several different methods of defining the set of samples used to train the partial least squares model to improve the accuracy of the multivariate regression model. We found that although clustering methods can modestly improve
results, a large and diverse training set is the most reliable way to improve the accuracy of quantitative LIBS.
Here is the unedited version of a radio interview I did with the Australian radio show Hack about my LIBS work in 2010:
Publications
- Ryan B. Anderson, et al. The influence of multivariate analysis methods and target grain size on the accuracy of remote quantitative chemical analysis of rocks using laser induced breakdown spectroscopy, Icarus, Volume 215, Issue 2, (2011) 608-627, https://doi.org/10.1016/j.icarus.2011.07.034.
- Ryan B. Anderson, et al. Clustering and training set selection methods for improving the accuracy of quantitative laser induced breakdown spectroscopy, Spectrochimica Acta Part B: Atomic Spectroscopy, Volume 70, (2012) 24-32, https://doi.org/10.1016/j.sab.2012.04.004.
Miscellaneous Other Work
In 2008, I wrote tools in IDL that make mosaics of data from the Mars Color Imager (MARCI). This camera has a 180 degree field of view, somewhat like a fish-eye lens, and it returns global maps of Mars daily. My program can search the data archive to make maps of any region on Mars at any time during the Mars Reconaissance Orbiter mission. By choosing the darkest pixel in cases where the data overlaps, I can minimize the effect of dust (bright in red) and clouds (bright in blue).


